Eleftherios Platis
AnalyticsAUEB02 / 06

Friends Across the Divide

How I rebuilt five figures from the Social Capital Atlas to show how cross-class friendships shape economic mobility in America.

ContextAUEB
AreaAnalytics
ToolsPython, pandas

01 — Abstract

As part of the Applied Machine Learning course in my BSc (2022), I replicated key figures from two landmark 2022 Nature papers by Chetty et al. Using data on 21 billion Facebook friendships, those papers showed that "economic connectedness" (EC), the extent to which lower-income people have higher-income friends, is one of the strongest predictors of upward income mobility in the United States. I rebuilt five of the studies' figures in Python using their public datasets. I built an interactive county-level choropleth of EC across 3,143 US counties, and plotted EC against children's adult income rank for the 197 largest counties I could match. I then examined EC against median household income across 16,822 ZIP codes, mapped friending bias against socioeconomic exposure in US high schools, and related friending bias to racial diversity using a Herfindahl–Hirschman Index, binned into weighted ventiles for 2,056 colleges and over 14,000 neighbourhoods. The work meant combining ten data files across four formats (CSV, Stata, GeoJSON and a scraped Wikipedia table), repairing broken FIPS and ZIP join keys, and reproducing the paper's binning methods. The replicated figures confirm the original findings. More connected places produce more upward mobility, connectedness matters at every income level, and exposure to other groups does not by itself create friendships across class lines.

02 — The problem

Where a child grows up strongly shapes how far they climb, but why some places produce more upward mobility than others has been hard to pin down. The Social Capital Atlas offered a striking answer: friendships across class lines matter more than almost anything else. Findings this influential are worth testing. So I wanted to know whether the headline results would hold up if I rebuilt them myself from the raw public data, without the authors' code.

03 — What I built

For the Applied Machine Learning course in my BSc (2022), I built a Python replication of five figures from the two Nature papers, using pandas, Plotly, seaborn and matplotlib:

  • Q1, geography: an interactive choropleth of economic connectedness across 3,143 US counties, binned into deciles with the paper's colour scale. It shows hover details and flags counties with no data.
  • Q2, outcomes: a regression of children's adult income rank (parents at the 25th percentile) against EC for the 197 matched counties among the 200 most populous.
  • Q3, income vs. connection: EC against median household income for 16,822 ZIP codes, coloured by upward-mobility bin.
  • Q4, high schools: friending bias against the share of high-income students, with 15 named schools annotated.
  • Q5, diversity: friending bias against racial diversity (HHI), as weighted ventile regressions for colleges and neighbourhoods. Most of the effort went into the data. I joined ten files from the Social Capital Atlas, the Opportunity Atlas, the papers' replication package, a county reference list and a scraped Wikipedia population table. Along the way I re-padded FIPS and ZIP codes that had lost their leading zeros, cleaned county names so text joins matched, and reproduced the paper's decile, quintile and weighted-ventile binning.

04 — What changed

All five figures reproduced the original findings:
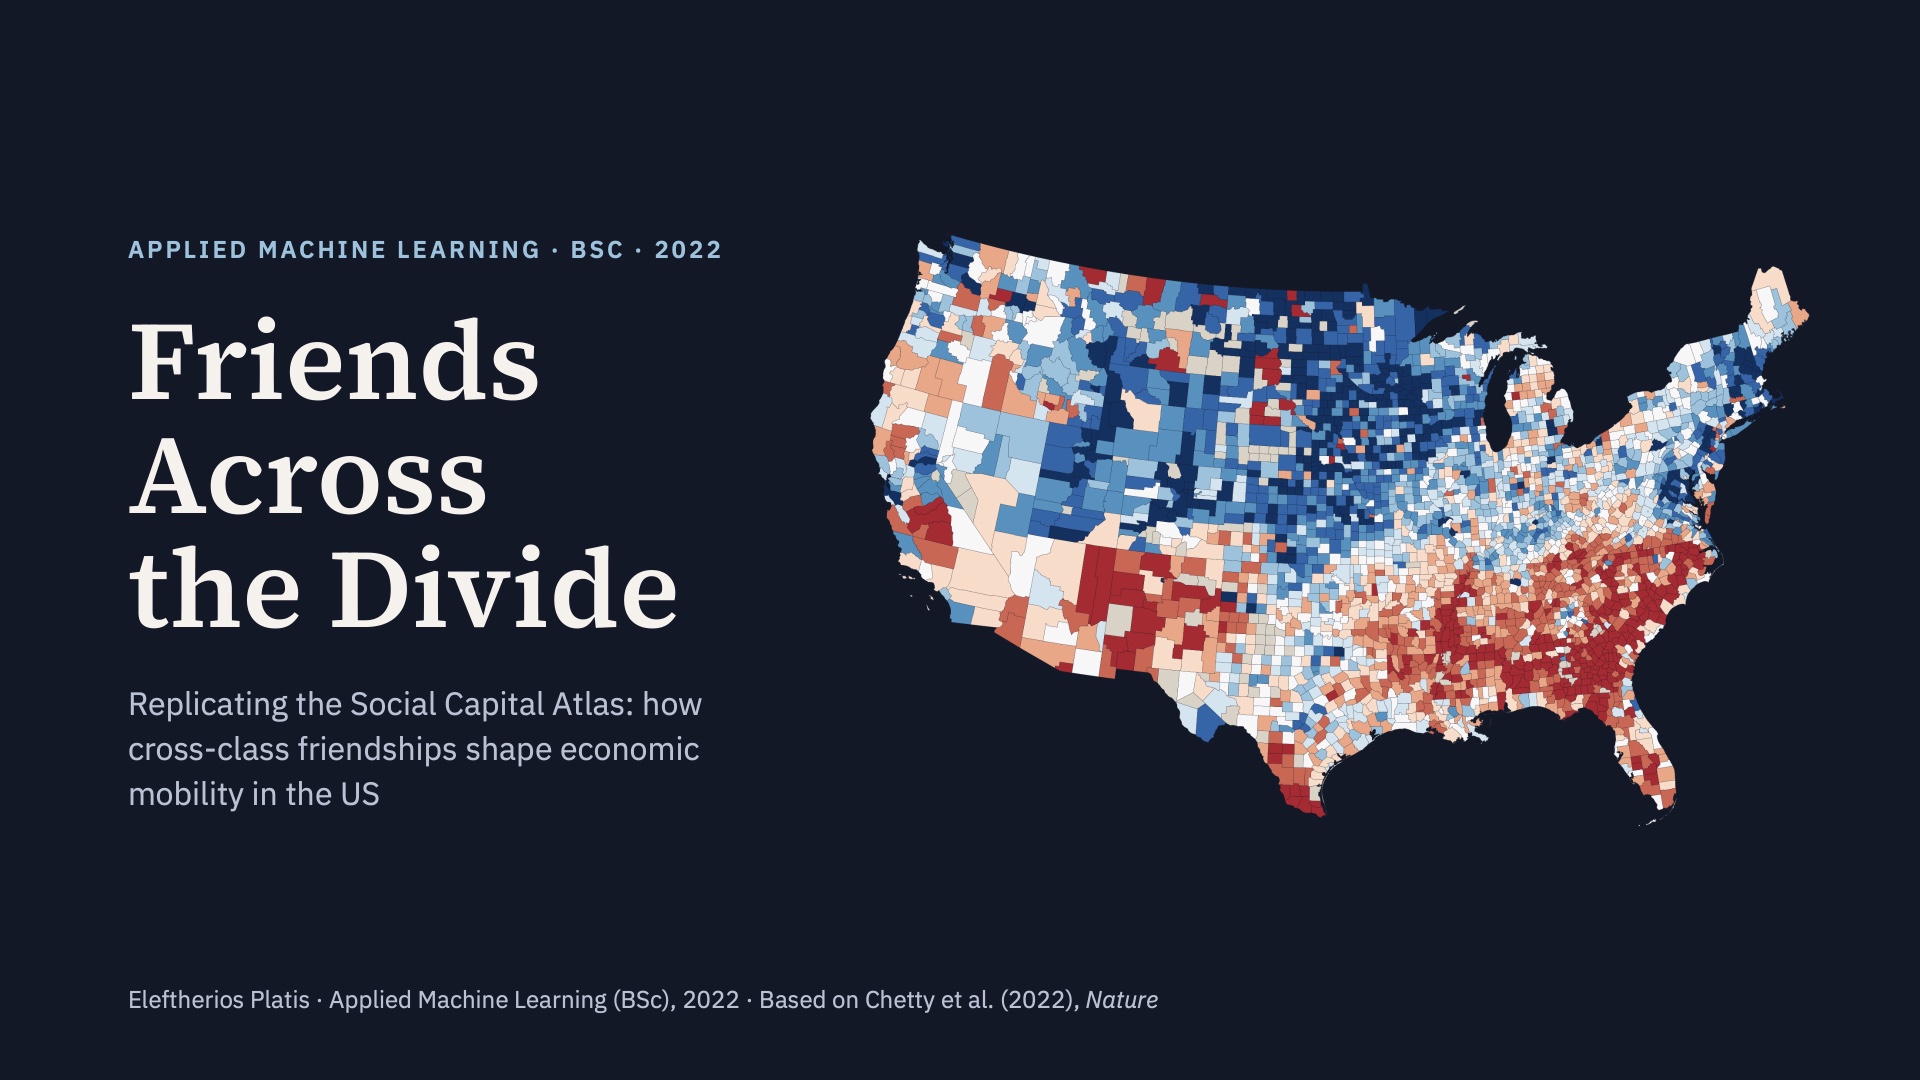
  • Connection predicts mobility. Children from low-income families do markedly better in more connected counties, with San Francisco near the top and Indianapolis near the bottom.
  • Income doesn't explain it away. At any given income level, high-mobility ZIP codes sit higher on connectedness.
  • Exposure isn't friendship. Schools with similar income mixes show very different levels of friending bias.
  • Diversity raises bias. In neighbourhoods, friending bias rises from about 0% in the least diverse areas to about 21% in the most diverse; in colleges the slope is much flatter. On top of the original static map I added an interactive layer. The project also became a practical exercise in reproducible research: turning a published claim into a working pipeline built on public data.

Presentation

Friends Across the Divide — slide 1 of 12
01 / 12

Links

Access the Colab Notebook↗Talk to me about this project↗
← PreviousPredicting driver route deviationsNext →The World Cup Crackdown